

Activity Level Nutrition Scaling: Why Your Calorie Needs Can Roughly Double
Depending on activity, daily energy needs range from about 1.2 to roughly 2.5 times your basal metabolic rate—so picking the wrong activity multiplier can leave you over- or underfueling by hundreds of calories a day.
This article is for general informational purposes only and is not a substitute for professional medical advice, diagnosis, or treatment. Always consult a qualified healthcare provider with questions about a medical condition.
The Spreadsheet That Changed Everything
Consider two coworkers. One, a software engineer, can't figure out why she's gaining weight eating 2,200 calories. The other, who's into CrossFit, thrives on 2,800. Same height. Same age. The difference? The first works from home and walks maybe 2,000 steps daily. The second trains six days a week and bikes to work.
They were using the same calorie calculator. Both selected "moderately active." Both were wrong.
Here's the uncomfortable truth: total daily energy expenditure ranges from about 1.2 times basal metabolic rate in very inactive people to roughly 2.5 times—the upper limit a 2004 review of doubly labeled water research found people can sustain over the long term. That's about a 2x swing for the same body. For someone with a 1,600-calorie basal metabolic rate, that's a difference of well over 1,500 calories per day at the extremes. Get your activity multiplier wrong by just one tier, and you can easily be off by a few hundred calories daily.
What Activity Multipliers Actually Measure
Forget vague descriptions like "lightly active" or "very active." Researchers now quantify activity using Physical Activity Level (PAL)—the ratio of your total daily energy expenditure to your basal metabolic rate.
A PAL of 1.2 means you burn 20% more than your resting metabolism. A PAL of 2.4 means you burn 140% more. That same 2004 review noted that in most adults, time spent in moderate-intensity activity—rather than short bursts of high intensity—largely determines where they fall.
The problem? Self-assessment is unreliable.
A 2008 systematic review of 187 studies found that correlations between self-reported and directly measured physical activity were generally only low to moderate, and self-reports were sometimes higher and sometimes lower than measured activity. In a classic 1992 New England Journal of Medicine study of people who said they couldn't lose weight despite eating very little, participants overreported their physical activity by an average of 51%—and underreported their food intake by 47%.
The Five Tiers, Decoded
Let's get specific. Most online calculators use the five multipliers below. They're conventional rules of thumb rather than precise measurements, but they map roughly onto real movement patterns.
Sedentary (PAL 1.2): You work a desk job, drive to work, and your main physical activity is walking to the coffee machine. Steps typically fall below 4,000 daily.
Lightly Active (PAL 1.375): You have a desk job but walk 30-45 minutes daily, or you work retail with moderate standing. Steps land between 5,000-7,500. Maybe you do yoga twice a week.
Moderately Active (PAL 1.55): This is where most people think they are, but few actually qualify. You exercise intentionally 3-5 times weekly at moderate intensity, or you have a job requiring constant movement—think nurses, teachers who pace, or restaurant servers. Steps exceed 10,000 most days.
Very Active (PAL 1.725): Hard exercise 6-7 days per week, or a physically demanding job combined with regular workouts. Construction workers who also hit the gym. Competitive recreational athletes training 8-10 hours weekly.
Extremely Active (PAL 1.9-2.4): Professional athletes, military in active training, or those with physically brutal jobs who also train. Tour de France cyclists hit PAL values above 2.5 during race weeks. This tier is rarer than people assume.
The Math Behind the 2.5x Range
Let's run real numbers. Take a 35-year-old woman, 5'6", 140 pounds. Her basal metabolic rate sits around 1,400 calories using the Mifflin-St Jeor equation.
At sedentary (1.2): 1,680 calories daily. At extremely active (2.4): 3,360 calories daily.
That's exactly 2x at the extremes. But here's where it gets interesting—the practical range most people encounter (sedentary to very active) spans 1,680 to 2,415 calories. Still a 44% difference.
For a 180-pound man with a BMR of 1,800? Sedentary gives him 2,160 calories. Very active pushes him to 3,105. He could eat an entire extra meal daily and maintain weight—if he actually hits that activity threshold.
Why Getting This Wrong Compounds Fast
The undereating problem doesn't get enough attention. The 2023 International Olympic Committee consensus statement on Relative Energy Deficiency in Sport (REDs) describes how low energy availability—too little energy left over after exercise to support normal body functions—can impair bone health, hormonal and menstrual function, metabolism, immunity, and performance, in both female and male athletes.
Overeating is obvious—your pants get tight. Undereating is insidious. You feel tired but blame stress. Your lifts stall but you assume you need a new program. Your immune system weakens but it's "just the season."
Recalibrating: How to Find Your Real Tier
Step one: track your movement objectively for two weeks. Not with your phone in your pocket half the time—wear a fitness tracker consistently. Note your daily steps, active minutes, and any structured exercise.
Step two: be brutally honest about intensity. A 30-minute walk isn't "moderate exercise" unless your heart rate stays elevated. Lifting weights for an hour but resting 3 minutes between sets? That's maybe 20 minutes of actual work.
Step three: account for non-exercise activity thermogenesis (NEAT). This is the sneaky variable. Some people fidget, pace while on calls, take stairs compulsively, and stand while working. Others sit still. According to a 2002 review, NEAT accounts for the majority of most people's non-resting energy expenditure; manual and agricultural workers have far higher NEAT than desk workers, and NEAT itself tends to rise with overfeeding and fall with underfeeding.
A practical test: if you're gaining weight slowly on your current intake and activity level, you're likely one tier lower than you thought. If you're losing weight unintentionally or feeling constantly depleted, you're probably one tier higher.
Scaling Macros, Not Just Calories
Here's what most guides miss: activity level doesn't just change how much you eat. It changes what you eat.
Protein needs rise modestly with training. Position stands from the International Society of Sports Nutrition and the American College of Sports Medicine recommend roughly 1.2–2.0 grams per kilogram of body weight per day for active people and athletes. But carbohydrate needs scale far more dramatically with activity.
A sedentary person might do fine on around 150 grams of carbs daily. A very active person doing glycolytic work (think HIIT, team sports, heavy lifting) might need 350-450 grams to fuel performance and recovery. Running low on muscle glycogen impairs high-intensity performance.
Fat fills the remaining calories; the ACSM joint position statement suggests it typically provides about 20–35% of total intake.
The 2016 ACSM joint position statement on nutrition and athletic performance offers a practical framework for daily carbohydrates: about 3–5 g per kilogram of body weight for light or skill-based activity, 5–7 g/kg for moderate exercise of about an hour a day, 6–10 g/kg for 1–3 hours of moderate-to-high-intensity training, and 8–12 g/kg for extreme training loads of 4–5 hours or more per day.
When Your Activity Level Fluctuates
Real life isn't static. You might train hard for a half-marathon, then take two months off. You might have a desk job but spend summers doing manual labor on a family farm. Injury happens. Seasons change.
Your body responds to a change in activity, but not always in tidy, predictable ways: appetite may not keep pace with your new energy needs, and NEAT can drift up or down. Your habits often lag behind, too.
Practical approach: recalculate your needs whenever your weekly exercise hours change by more than 3, or when your daily step average shifts by more than 2,500 for two consecutive weeks. Build in transition periods where you adjust intake by 200-300 calories rather than making dramatic jumps.
One simple system some endurance athletes use: three eating patterns saved in a tracking app—for example, about 2,200 calories for a rest week, 2,600 for normal training, and 3,100 for peak training—chosen based on the actual training load that week, not an idealized schedule.
The Precision Paradox
Here's the twist nobody talks about: getting more precise about activity multipliers matters less if your food tracking is sloppy.
Studies comparing reported intake with objective measures show that underreporting is common—in the 1992 NEJM study, participants underreported their intake by 47%. If you're off by 500 calories on the input side, obsessing over whether your multiplier should be 1.55 or 1.6 is pointless theater.
The goal isn't perfect calculation. It's getting close enough that your body composition moves in the direction you want, then adjusting based on real-world feedback. Weigh yourself weekly (same conditions each time). Track your energy levels. Monitor workout performance. Take progress photos monthly.
The numbers are a starting point. Your body's response is the answer key.
Start with an honest assessment of your activity tier—probably one level below what your ego wants to claim. Set your calories there. Give it three weeks. Then adjust based on what actually happens, not what the calculator promised.
📊 Key Stats
Activity Tier Breakdown: PAL Values and Real-World Examples
| Activity Tier | PAL Multiplier | Daily Steps | Weekly Exercise | Real-World Example |
|---|---|---|---|---|
| Sedentary | 1.2 | <4,000 | None/minimal | Remote desk worker, drives everywhere |
| Lightly Active | 1.375 | 5,000-7,500 | 1-2 light sessions | Office worker who walks 30 min daily |
| Moderately Active | 1.55 | 7,500-10,000 | 3-5 moderate sessions | Nurse, teacher, or regular gym-goer |
| Very Active | 1.725 | 10,000-15,000 | 6-7 hard sessions | Construction worker who also trains |
| Extremely Active | 1.9-2.4 | 15,000+ | Professional training | Competitive athlete, military training |
Multipliers are the conventional values used by most online calculators; they are rough estimates, not measured values.
❓ Frequently Asked Questions
How do I know if I'm actually 'moderately active' versus 'lightly active'?
Should I eat more on workout days and less on rest days?
Why do I feel hungrier on rest days than training days?
Can my activity multiplier change even if my exercise stays the same?
How quickly should I adjust calories when my activity level changes?
Do activity multipliers work differently for older adults?
What if I have a physical job but don't exercise?
What is HAVIT?
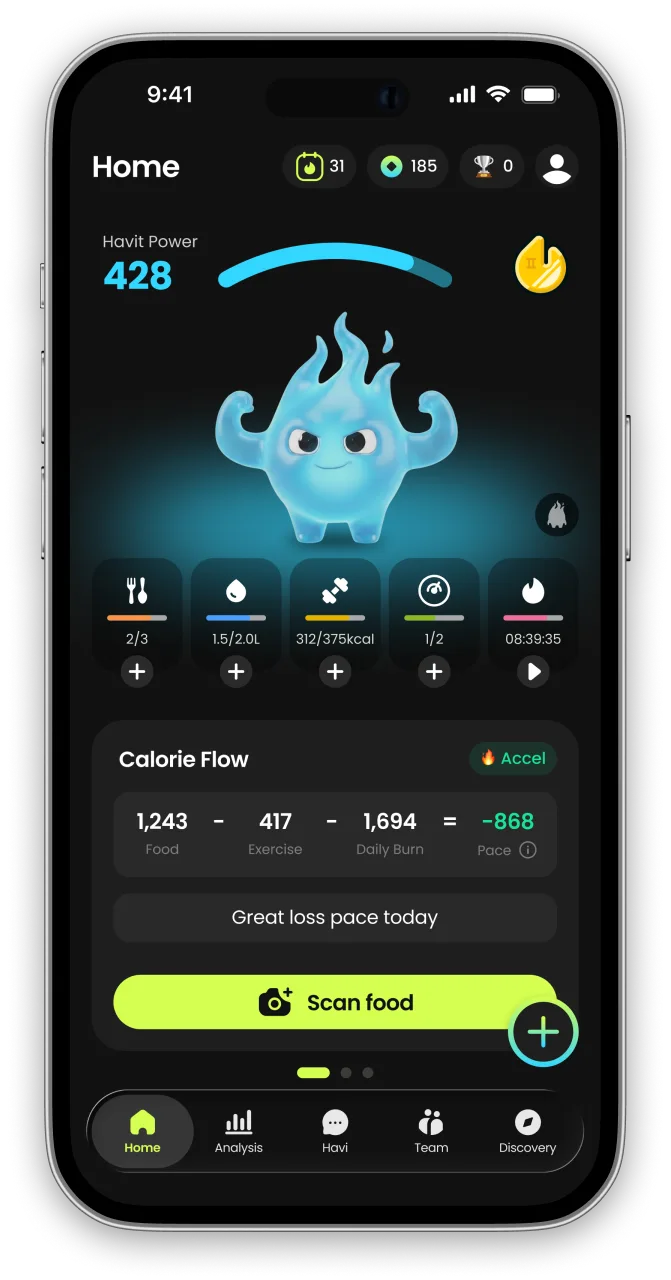
HAVIT is an AI health partner built on metabolic science — it protects your muscle, wakes up your metabolism, and helps you keep a healthy, rebound-free body for the long run.
Unlike calorie-only trackers, HAVIT connects AI body-composition estimates, nutrition, hydration, sleep, steps, cycle, mood, and GLP-1 medication in one daily routine — so progress is measured by body composition, not just the number on the scale. Daily missions turn established behavior-change techniques into small repeatable actions, drawing on expertise from professionals formerly at Juvis Diet, one of Korea’s leading metabolic clinics.
In HAVIT’s own analysis of 1,090 GLP-1 users, people who logged consistently built stronger habits than the general user base. Read the GLP-1 Habit Report
Inside the app
- AI COACHA coach that reads your day.
- NUTRITIONLog meals in seconds.
- BODY INSIGHTSSee more than weight.
- DAILY MISSIONSBuild habits you can repeat.
- DAILY CHECK-INTell HAVI how today feels.
- TRACK EVERYTHINGFrom water to GLP-1
- MIND & RECOVERYFor the days willpower runs out.


HAVIT works with or without GLP-1 medication. It is a wellness app, not a medical device; body-composition results are estimates.

Continue in the App
Personalized wellness with your own data


References
- Physical activity and human energy expenditure — Current Opinion in Clinical Nutrition and Metabolic Care, 2004
- A comparison of direct versus self-report measures for assessing physical activity in adults: a systematic review — International Journal of Behavioral Nutrition and Physical Activity, 2008
- Discrepancy between Self-Reported and Actual Caloric Intake and Exercise in Obese Subjects — New England Journal of Medicine, 1992
- Non-exercise activity thermogenesis (NEAT) — Best Practice & Research Clinical Endocrinology & Metabolism, 2002
- Nutrition and Athletic Performance — Medicine & Science in Sports & Exercise, 2016
- International Society of Sports Nutrition position stand: protein and exercise — Journal of the International Society of Sports Nutrition, 2007
- 2023 International Olympic Committee’s (IOC) consensus statement on Relative Energy Deficiency in Sport (REDs) — British Journal of Sports Medicine, 2023
- Reasons for and Consequences of Low Energy Availability in Female and Male Athletes: Social Environment, Adaptations, and Prevention — Sports Medicine - Open, 2020
- Daily energy expenditure through the human life course — Science, 2021
- A new predictive equation for resting energy expenditure in healthy individuals — The American Journal of Clinical Nutrition, 1990


