

Post-Meal Glucose Spikes in Non-Diabetics: What 140 vs 160 mg/dL Actually Means for Your CGM Data
In healthy adults, glucose stays between 70-140 mg/dL most of the day and brief post-meal rises above 140 are common; occasional readings up to 160 mg/dL aren't cause for alarm on their own—patterns and recovery time matter more than single peaks.
This article is for general informational purposes only and is not a substitute for professional medical advice, diagnosis, or treatment. Always consult a qualified healthcare provider with questions about a medical condition.
That Moment Your CGM Hits 156 After Lunch
You glance at your Dexcom Stelo app. The number stares back: 156 mg/dL. Your heart rate picks up. Is this bad? Should you be worried? You just had a turkey sandwich.
Here's the thing—that number alone tells you almost nothing.
Millions of non-diabetics now wear continuous glucose monitors. The technology that once belonged exclusively to diabetes management has gone mainstream. Dexcom Stelo launched for general wellness in 2024. Abbott's Libre 3 sits on pharmacy shelves. And suddenly, people who've never thought about blood sugar are watching their glucose curves like day traders watching stock tickers.
The problem? Nobody gave us a user manual for interpreting these numbers when we're metabolically healthy.
The 140 vs 160 Debate: Where These Numbers Come From
Walk into any online health forum and you'll find fierce arguments. Some insist anything above 140 mg/dL signals metabolic dysfunction. Others shrug off readings in the 170s as totally normal.
Both camps are partially right. Both are missing crucial context.
The 140 mg/dL threshold originated from diabetes screening criteria—specifically, the two-hour mark during an oral glucose tolerance test. If you're still above 140 at the two-hour point, that raises flags. But this number was never meant to define the acceptable peak after a regular meal.
Data from healthy people backs this up. A multicenter study that fitted 153 healthy, non-obese participants without diabetes with blinded CGMs found mean glucose of about 98-99 mg/dL (104 mg/dL in those over 60), a median of 96% of the day spent between 70 and 140 mg/dL, and a median of 2.1% of the day—about 30 minutes—above 140 mg/dL (Shah et al., Journal of Clinical Endocrinology & Metabolism, 2019). In other words, healthy people do go above 140 mg/dL, briefly.
A 32-year-old marathoner hitting 158 mg/dL forty minutes after oatmeal, then dropping to 95 within ninety minutes? That's a healthy glucose response. A sedentary 45-year-old lingering at 145 mg/dL three hours after the same meal? That pattern deserves attention.
What Healthy Glucose Curves Actually Look Like
A Stanford study that tracked adults with CGMs found something similar from another angle: even people classified as normoglycemic by standard tests showed considerable glucose variability, with levels in the prediabetic range about 15% of the time and in the diabetic range 2% of the time (Hall et al., PLoS Biology, 2018).
The researchers grouped participants into "glucotypes" based on how variable their glucose was, and responses to identical standardized meals differed widely from person to person. Whether such brief excursions in otherwise healthy people predict future health problems is still being studied.
In everyday CGM data, post-meal curves often fall into a few rough shapes. These are descriptive patterns, not diagnostic categories:
Quick spikers: Peak within 30-45 minutes, often reaching 140-160 mg/dL, but crash back to baseline within 90 minutes. These people tend to have robust insulin responses—their pancreas acts fast and hard.
Slow burners: Gradual rise to a modest peak (110-130 mg/dL) around 60-75 minutes, gentle decline over two hours. Common in people who eat slowly, combine macros well, or have naturally lower carb absorption rates.
Rollercoaster riders: Multiple peaks and valleys after eating, sometimes spiking, dropping below baseline, then rebounding. This pattern often correlates with meals combining sugar and fat, or with stress eating.
None of these patterns are inherently pathological. They're just different metabolic signatures.
The Recovery Window: Your Most Important Metric
Forget obsessing over peak numbers for a moment. How long glucose stays elevated—and whether that happens meal after meal—tells you more about your overall pattern than a single peak.
That fits what healthy profiles look like: in the multicenter study above, time above 140 mg/dL added up to only about half an hour a day, which means most excursions were brief (Shah et al., 2019).
What hasn't been settled is whether short versus longer elevations in people without diabetes predict future cardiometabolic risk. Long-term studies in this group are limited, so treat recovery time as a useful pattern to watch, not a diagnosis.
So a sharp spike that resolves quickly isn't automatically worse than a modest rise that lingers. The overall pattern across many meals is what's worth watching.
Real-World Thresholds: A Practical Framework
So what numbers should actually concern you?
Drawing on standard diagnostic cutoffs (a fasting glucose of 100-125 mg/dL or a 2-hour oral glucose tolerance test value of 140-199 mg/dL indicates prediabetes; American Diabetes Association, Diabetes Care, 2024) and CGM data from healthy adults, here's a rough working framework for non-diabetics using CGMs. It's a personal guide, not a clinical standard:
Green zone (no action needed):
- Post-meal peaks under 140 mg/dL
- Return to baseline within 2 hours
- Fasting glucose 70-100 mg/dL
- Less than 5% of readings above 140 over a typical week
Yellow zone (worth investigating):
- Regular peaks between 140-160 mg/dL after moderate-carb meals
- Taking 2-3 hours to return to baseline
- Fasting glucose consistently 95-105 mg/dL
- 10-15% of readings above 140 weekly
Orange zone (consider lifestyle changes or medical consultation):
- Peaks above 160 mg/dL after typical meals
- Rarely returning to baseline within 3 hours
- Fasting glucose above 100 mg/dL most mornings
- More than 20% of readings above 140 weekly
Note what's missing: absolute panic thresholds. Because a single reading of 172 mg/dL after birthday cake at your kid's party means exactly nothing about your metabolic health.
The Meal Composition Variable Nobody Talks About
That 156 mg/dL after your turkey sandwich? Let's unpack it.
Was the bread white or whole grain? Did you eat the sandwich in four minutes while answering emails, or over twenty minutes at a proper lunch break? Had you walked that morning or sat in meetings since 7 AM?
All of these factors shift your glucose response dramatically.
Research shows how large this variability can be. A study that continuously monitored glucose in 800 people and measured responses to nearly 47,000 meals found high variability in responses to identical meals (Zeevi et al., Cell, 2015). Order matters too: in a small study of people with type 2 diabetes, eating vegetables and protein before carbohydrates lowered post-meal glucose by about 29%, 37%, and 17% at 30, 60, and 120 minutes compared with eating the carbohydrates first (Shukla et al., Diabetes Care, 2015). And a meta-analysis of randomized crossover trials found that breaking up sitting with light walking significantly blunted post-meal glucose (Buffey et al., Sports Medicine, 2022).
This variability isn't a bug in your metabolism. It's a feature. Your body responds to context.
Dexcom Stelo vs Libre 3: Do the Numbers Match?
If you've worn both devices, you've probably noticed something: they don't always agree.
Readings can differ between CGM brands and even between sensors from the same manufacturer. Each system has its own accuracy profile and regulatory classification (Bailey & Alva, Diabetes Technology & Therapeutics, 2021), so small differences between devices are expected.
Neither is wrong. They're measuring interstitial fluid glucose, which lags behind blood glucose by 5-15 minutes and can be affected by sensor placement, hydration, and local blood flow.
The practical implication? Don't compare your Stelo numbers to your friend's Libre numbers. Don't even compare your current sensor to your last one too rigidly. Look for patterns within a single sensor's lifespan, and focus on relative changes rather than absolute values.
When to Actually Worry (And When to Chill)
Let's be direct. You should pay attention if:
You consistently see fasting glucose above 100 mg/dL across multiple mornings and multiple sensors. You regularly spike above 160 mg/dL after meals that aren't particularly carb-heavy. You notice you're still elevated three hours after eating, meal after meal. You experience symptoms like unusual fatigue, excessive thirst, or frequent urination alongside elevated readings.
You should probably relax if:
You spiked to 165 after pizza and beer on a Friday night. Your fasting glucose was 103 one morning after terrible sleep. You hit 150 after a stressful lunch eaten in five minutes. Your CGM showed a weird spike at 3 AM that didn't correlate with anything (compression artifacts from sleeping on the sensor are common).
Context. Always context.
Building Your Personal Baseline
Here's what I'd suggest for anyone new to CGM tracking without diabetes:
Wear the sensor for at least two weeks before drawing any conclusions. Your first few days will be noisy—both because you're still calibrating to the device and because you'll unconsciously eat differently while being watched.
During week two, eat your normal diet. Don't perform for the sensor. Have the pasta. Drink the wine. See what your actual life looks like in glucose terms.
Then, in week three, start experimenting. What happens when you walk for ten minutes after dinner? How does your response to rice change if you eat the vegetables first? Does that morning coffee spike you, or is it the muffin you eat with it?
This personal data matters infinitely more than any threshold number from a research paper. Your body isn't average. Your glucose responses shouldn't be judged against averages.
The Bigger Picture on Metabolic Health
CGM data is one signal among many.
Your sleep quality affects your glucose. Your stress hormones affect your glucose. Your menstrual cycle (if applicable) affects your glucose. Your gut microbiome, your muscle mass, your recent illness, your hydration—all of it shows up in those squiggly lines on your app.
The goal isn't to achieve perfect flatline glucose curves. That's neither realistic nor necessarily optimal. The goal is to understand your patterns, identify the factors you can influence, and make informed choices about the tradeoffs you're willing to accept.
Sometimes the birthday cake is worth the spike. Sometimes you'll choose the salad because you have an important afternoon ahead. Both choices can be right.
Your CGM is a tool for awareness, not a judge of your worthiness. Use it to learn. Then use what you learn to live better—whatever that means for you.
📊 Key Stats
Post-Meal Glucose Thresholds for Non-Diabetics: Action Framework
| Zone | Peak Range | Recovery Time | Weekly % Above 140 | Suggested Action |
|---|---|---|---|---|
| Green | Under 140 mg/dL | Under 2 hours | Less than 5% | No changes needed |
| Yellow | 140-160 mg/dL | 2-3 hours | 10-15% | Track patterns, experiment with meal composition |
| Orange | Above 160 mg/dL | Over 3 hours | Over 20% | Consider lifestyle modifications, consult healthcare provider |
Illustrative framework drawing on ADA diagnostic cutoffs and CGM data from healthy adults (Shah et al., 2019); not a clinical standard. Individual variation expected; patterns matter more than single readings.
❓ Frequently Asked Questions
Is 145 mg/dL after a meal bad for a non-diabetic?
Why does my CGM show different numbers than my friend's for the same meal?
Should I be concerned about glucose spikes while sleeping?
How long should I wear a CGM before drawing conclusions about my metabolic health?
Does the 140 mg/dL threshold apply to all foods equally?
Can stress alone cause glucose spikes without eating?
What's more important: peak glucose level or time spent elevated?
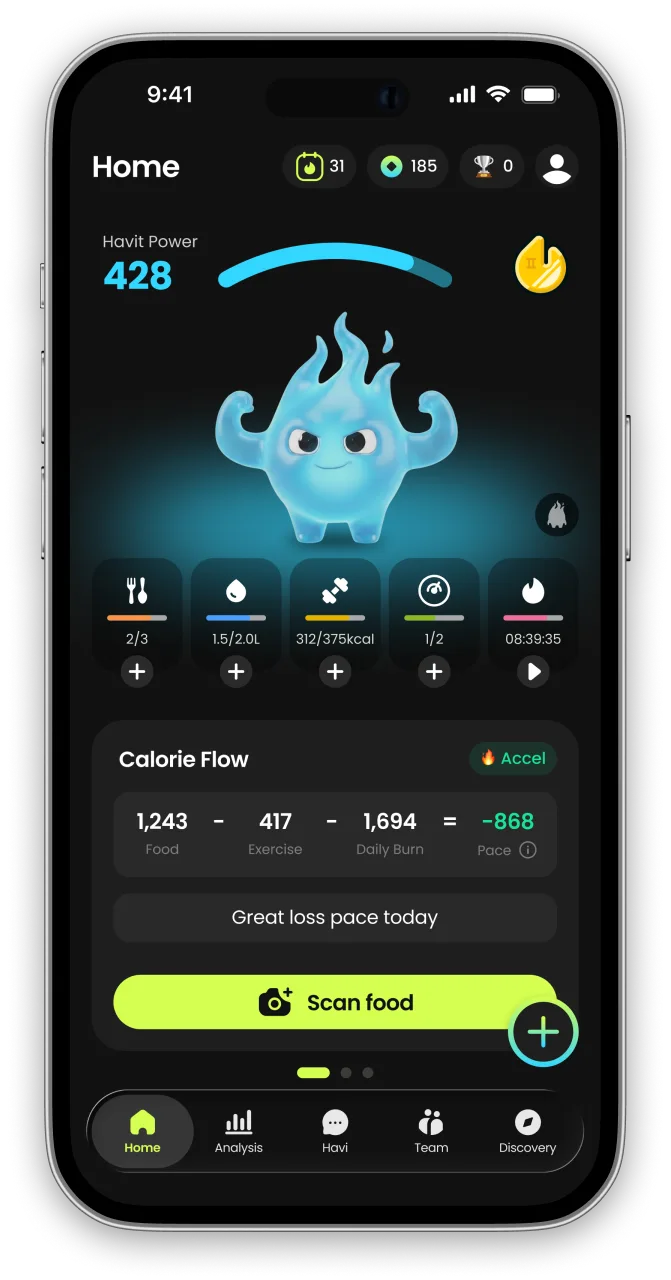
What is HAVIT?
HAVIT is an AI health partner built on metabolic science — it protects your muscle, wakes up your metabolism, and helps you keep a healthy, rebound-free body for the long run.
Unlike calorie-only trackers, HAVIT connects AI body-composition estimates, nutrition, hydration, sleep, steps, cycle, mood, and GLP-1 medication in one daily routine — so progress is measured by body composition, not just the number on the scale. Daily missions turn established behavior-change techniques into small repeatable actions, drawing on expertise from professionals formerly at Juvis Diet, one of Korea’s leading metabolic clinics.
In HAVIT’s own analysis of 1,090 GLP-1 users, people who logged consistently built stronger habits than the general user base. Read the GLP-1 Habit Report
Inside the app
- AI COACHA coach that reads your day.
- NUTRITIONLog meals in seconds.
- BODY INSIGHTSSee more than weight.
- DAILY MISSIONSBuild habits you can repeat.
- DAILY CHECK-INTell HAVI how today feels.
- TRACK EVERYTHINGFrom water to GLP-1
- MIND & RECOVERYFor the days willpower runs out.


HAVIT works with or without GLP-1 medication. It is a wellness app, not a medical device; body-composition results are estimates.

Continue in the App
Personalized wellness with your own data


References
- Continuous Glucose Monitoring Profiles in Healthy Nondiabetic Participants: A Multicenter Prospective Study — Journal of Clinical Endocrinology & Metabolism, 2019
- Glucotypes reveal new patterns of glucose dysregulation — PLoS Biology, 2018
- Personalized Nutrition by Prediction of Glycemic Responses — Cell, 2015
- 2. Diagnosis and Classification of Diabetes: Standards of Care in Diabetes—2024 — Diabetes Care, 2024
- Food Order Has a Significant Impact on Postprandial Glucose and Insulin Levels — Diabetes Care, 2015
- The Acute Effects of Interrupting Prolonged Sitting Time in Adults with Standing and Light-Intensity Walking on Biomarkers of Cardiometabolic Health in Adults: A Systematic Review and Meta-analysis — Sports Medicine, 2022
- Landscape of Continuous Glucose Monitoring (CGM) and Integrated CGM: Accuracy Considerations — Diabetes Technology & Therapeutics, 2021


