

Satiety Index Chart: 38 Foods Ranked by Fullness and the Science of Staying Full
The satiety index ranks how full 38 common foods keep you per 240-calorie portion, compared with white bread at 100: boiled potatoes scored highest (323) and croissants lowest (47). Boiled potatoes still reign supreme for fullness, but combining protein, fiber, and water content creates meals that satisfy for hours.
This article is for general informational purposes only and is not a substitute for professional medical advice, diagnosis, or treatment. Always consult a qualified healthcare provider with questions about a medical condition.
Why Does a Croissant Leave You Hungry an Hour Later?
You ate breakfast. A real breakfast—not just coffee. Yet by 10 AM, your stomach is growling like you skipped the meal entirely. Meanwhile, your coworker who had eggs and oatmeal seems perfectly content until lunch. What gives?
The answer lies in something called the satiety index, a measure of how filling foods actually are compared to white bread (which scores 100 as the baseline). Some foods clock in at 323. Others barely hit 47. The difference between feeling satisfied and raiding the vending machine often comes down to choices you didn't even realize mattered.
What the Satiety Index Actually Measures
Back in 1995, researcher Susanna Holt and her team at the University of Sydney fed participants 240-calorie portions of 38 different foods. They tracked hunger levels every 15 minutes for two hours. The results created the original satiety index—and some findings still surprise people today.
Boiled potatoes scored 323, making them over three times more filling than white bread calorie-for-calorie. Croissants? A measly 47. That's not a typo. The buttery pastry that feels so indulgent actually leaves your hunger signals firing harder than almost any other food tested.
Later studies have added nuance: how a food is prepared and served changes how filling it is. In one experiment, eating a whole apple before lunch cut total meal calories by 15% and was more filling than the same apple eaten as applesauce or juice.
Satiety Index Chart by Food Group
The satiety index is easiest to use as a chart. Each score compares how full a 240-calorie portion of a food kept people over two hours with the same calories of white bread, which is set at 100. The score is the area under each food's fullness curve divided by white bread's, times 100—so a food scoring 200 produced roughly twice the fullness of white bread, calorie for calorie.
| Food group | Higher satiety (score) | Lower satiety (score) |
|---|---|---|
| Carbohydrate-rich foods | Boiled potatoes (323), whole grain bread (157) | White rice (138), white bread (100, reference) |
| Protein-rich foods | Steamed fish (225), beef steak (176) | Eggs (150), cheese (146) |
| Breakfast | Oatmeal porridge (209) | — |
| Fruit | Oranges (202), apples (197) | Grapes (162) |
| Snacks and sweets | Popcorn (154) | Ice cream (96), chips (91), peanuts (84), candy bars (70) |
| Bakery | — | Donuts (68), croissants (47) |
How to read these numbers
- It is per calorie, not per serving. A 240-calorie portion of boiled potatoes is a big plate; 240 calories of croissant is roughly a single pastry. Much of the gap comes from portion size and weight.
- What drove the scores. In the original analysis, the heavier the 240-calorie serving, the higher the score—serving weight was one of the strongest correlates. More protein, fiber, and water also went with higher scores, while more fat and higher palatability (how tasty people rated the food) went with lower scores.
- What it does not tell you. Fullness was tracked for only two hours, in groups of 11-13 people per food, and the index says nothing about vitamins, minerals, or overall diet quality. Use it to build filling meals, not to label foods "good" or "bad".
What Makes Food Actually Filling
When researchers dig into why certain foods satisfy while others leave you reaching for more, a few patterns emerge consistently. The picture is more nuanced than any single factor, but understanding these mechanisms helps explain the sometimes counterintuitive rankings.
Protein stands out as perhaps the strongest predictor. Foods with higher protein content per calorie trigger robust satiety hormones, particularly peptide YY and GLP-1. This explains why fish scored 225 on the original index and beef came in at 176—both dramatically outperforming refined carbohydrates despite similar calorie counts.
Fiber plays a different but equally important role. It creates physical bulk without adding absorbable calories, and your stomach has stretch receptors that signal fullness based on volume. This is why a cup of popcorn takes up far more space than the equivalent calories in cheese, even though cheese has more protein.
Water content works through similar mechanisms—but mainly when the water is part of the food. In a classic 1999 study, women who ate chicken rice soup before lunch ate significantly less at the meal than when they ate the same ingredients as a casserole with a glass of water alongside.
Energy density ties everything together. Foods packing lots of calories into small volumes—think nuts, oils, chocolate—tend to score lower despite being nutritious. Your body gauges fullness partly by weight and volume, not just calories. This creates some surprising results that trip people up.
Updated Rankings: What Keeps You Fullest Longest
Here's where practical application begins. Based on the original index plus subsequent validation studies, foods cluster into distinct tiers.
At the top, scoring 200 and above, you find boiled potatoes leading at 323. Steamed fish follows at 225, oatmeal porridge hits 209, and oranges score 202. These foods deliver exceptional fullness per calorie.
The next tier, ranging from 150 to 199, includes apples at 197, beef steak at 176, grapes at 162, whole grain bread at 157, and popcorn at 154.
Middle-ground foods scoring between 100 and 149 include white rice at 138, cheese at 146, and eggs at 150. These satisfy reasonably well without standing out.
Below the baseline, things get interesting. White bread sits at 100 as the reference point. Ice cream drops to 96, chips fall to 91, peanuts score 84, and candy bars hit 70. Croissants and donuts anchor the bottom at 47 and 68.
Notice something counterintuitive? Peanuts—often recommended for snacking—score quite low. They're nutritious and contain protein and healthy fats, but their caloric density undermines satiety per calorie. An ounce of peanuts has roughly 160 calories. An entire orange has 60 calories and keeps you fuller longer.
Building Meals That Actually Satisfy
Knowing individual food scores helps, but meal construction matters more in practice. A breakfast of eggs alone (150) becomes more filling when paired with oatmeal (209) and berries. The scores don't simply add up, but combining protein, fiber and water-rich foods covers several fullness mechanisms at once.
Start with a high-satiety anchor. Make potatoes, fish, oatmeal, or legumes the foundation of your meal. These heavy hitters do the bulk of the work.
Add volume through vegetables. A plate that looks full triggers psychological satisfaction before you take a bite. Pile on leafy greens, tomatoes, cucumbers. They contribute almost negligible calories while creating visual and physical bulk.
Include deliberate protein. Aim for 25-30 grams per meal minimum. This threshold consistently triggers stronger hormone responses than smaller amounts. A chicken breast provides about 25 grams. Three eggs deliver roughly 18 grams. Greek yogurt offers 15-20 grams per cup.
Don't fear carbohydrates—choose wisely. Whole grains, legumes, and starchy vegetables satisfy far better than refined options. The fiber slows digestion. The nutrients signal your body that real food has arrived.
The Soup Strategy: A Simple Hack That Works
Researchers have consistently found that consuming foods in soup form increases satiety compared to eating the same ingredients separately with a glass of water. In that 1999 study, lunch intake after the soup was roughly a quarter lower than after the casserole served with water.
Why? Soups empty from the stomach more slowly. The liquid and solid components blend into a mixture that takes longer to process. Your hunger signals stay suppressed longer.
This doesn't mean living on broth. A chunky vegetable soup with beans and chicken creates a complete meal. A blended butternut squash soup with added protein powder becomes surprisingly filling. Even adding a cup of broth-based soup before your main course can reduce overall intake by 100-150 calories without feeling deprived.
Timing and Meal Frequency Considerations
High-satiety foods at breakfast may produce ripple effects throughout the day. In a small 2013 study of overweight teenage girls who usually skipped breakfast, a higher-protein breakfast increased fullness, raised the satiety hormone PYY and reduced evening snacking on high-fat foods compared with skipping breakfast.
The protein leverage hypothesis offers one explanation. Your body seeks a certain amount of protein daily. Eat it early, and cravings diminish. Skimp at breakfast, and you'll unconsciously seek it out—often through less ideal sources—later.
Spacing matters too. Eating every 2-3 hours keeps hunger manageable for some people. Others thrive on three substantial meals with no snacks. The satiety index helps either approach: choose high-scoring foods for meals, and if you snack, pick oranges over granola bars, popcorn over pretzels.
Common Mistakes That Undermine Fullness
Drinking calories rarely satisfies. Fruit juice, smoothies, and sweetened beverages bypass many satiety mechanisms. The sugar hits your bloodstream fast. Your stomach registers minimal volume. Liquid calories simply don't trigger the same fullness signals as solid food—even when nutritionally similar.
Food temperature is less clear-cut. Many people find a warm bowl of oatmeal or soup more satisfying than a cold one, but evidence that temperature by itself changes fullness is limited—focus first on protein, fiber, and water content.
Overprocessing reduces satiety potential. Whole apples score 197, and in a direct comparison a whole apple was more filling than applesauce or apple juice with the same calories. Baked potatoes satisfy enormously; instant mashed potatoes from a box are likely much less filling. Processing breaks down fiber structure and often removes water content—two pillars of fullness.
Practical Meal Templates
For breakfast, consider two eggs scrambled with spinach and tomatoes, one slice of whole grain toast, and half an orange. Alternatively, try oatmeal cooked with water, topped with sliced apple and a handful of walnuts, alongside Greek yogurt.
At lunch, try a large salad with grilled chicken breast, chickpeas, cucumber, bell peppers, and olive oil dressing—or lentil soup with whole grain bread and a side of grapes.
For dinner, try baked salmon with roasted potatoes and steamed broccoli, or a beef stir-fry with brown rice and mixed vegetables.
These aren't prescriptions—they're templates showing how high-satiety ingredients combine into satisfying meals.
When Low Satiety Foods Make Sense
Not every eating occasion requires maximum fullness. Athletes needing quick energy during competition benefit from fast-digesting, low-satiety options. Someone struggling to eat enough calories might deliberately choose energy-dense, lower-satiety foods to meet their needs.
The satiety index describes one dimension of food quality. Nutrition, enjoyment, cultural significance, and practical constraints all matter too. A croissant at a Parisian café creates memories worth more than its satiety score. Birthday cake serves purposes beyond hunger management.
The goal isn't eliminating low-satiety foods—it's understanding their effects so you can make informed choices. Save the croissant for when you want a croissant, not for a Tuesday morning when you need to stay focused until lunch.
The Bottom Line on Staying Full
Hunger isn't a character flaw or lack of willpower. It's a physiological signal influenced heavily by food choices. The satiety index gives you a framework for understanding why some meals satisfy and others leave you searching the pantry an hour later.
Boiled potatoes, fish, oatmeal, and oranges anchor the high end. Pastries, candy, and chips anchor the low end. Most foods fall somewhere between. Building meals around high-satiety anchors—while adding protein, fiber, and volume—creates eating patterns that satisfy without requiring constant willpower.
Your 10 AM hunger might not disappear entirely. But understanding what drives it gives you tools to manage it on your terms.
📊 Key Stats
Satiety Index Rankings by Food Category
| Food | Satiety Score | Key Satiety Factor | Practical Notes |
|---|---|---|---|
| Boiled Potatoes | 323 | High water + fiber | Best eaten whole, not mashed |
| Steamed Fish | 225 | High protein | White fish scores highest |
| Oatmeal | 209 | Fiber + water | Cooked oats beat instant |
| Oranges | 202 | Water + fiber | Whole fruit, not juice |
| Apples | 197 | Fiber + volume | Eat with skin |
| Beef Steak | 176 | Protein density | Lean cuts score higher |
| Eggs | 150 | Protein | Preparation method matters less |
| White Bread | 100 | Baseline | Reference point |
| Ice Cream | 96 | Fat + sugar | Low despite calories |
| Croissant | 47 | Fat + refined carbs | Lowest satiety per calorie |
Scores based on 240-calorie portions compared to white bread baseline of 100. Higher scores indicate greater fullness.
❓ Frequently Asked Questions
What is the satiety index?
Which food has the highest satiety index?
Why do potatoes score so high when they're often considered fattening?
Do cooking methods change a food's satiety score?
Why don't nuts score higher despite having protein and healthy fats?
Can I use the satiety index for weight loss?
Why does soup increase satiety compared to eating ingredients separately?
Is the satiety index the same as glycemic index?
How long do high-satiety foods keep you full?
Which foods have the lowest satiety index?
How is a satiety index score calculated?
What is HAVIT?
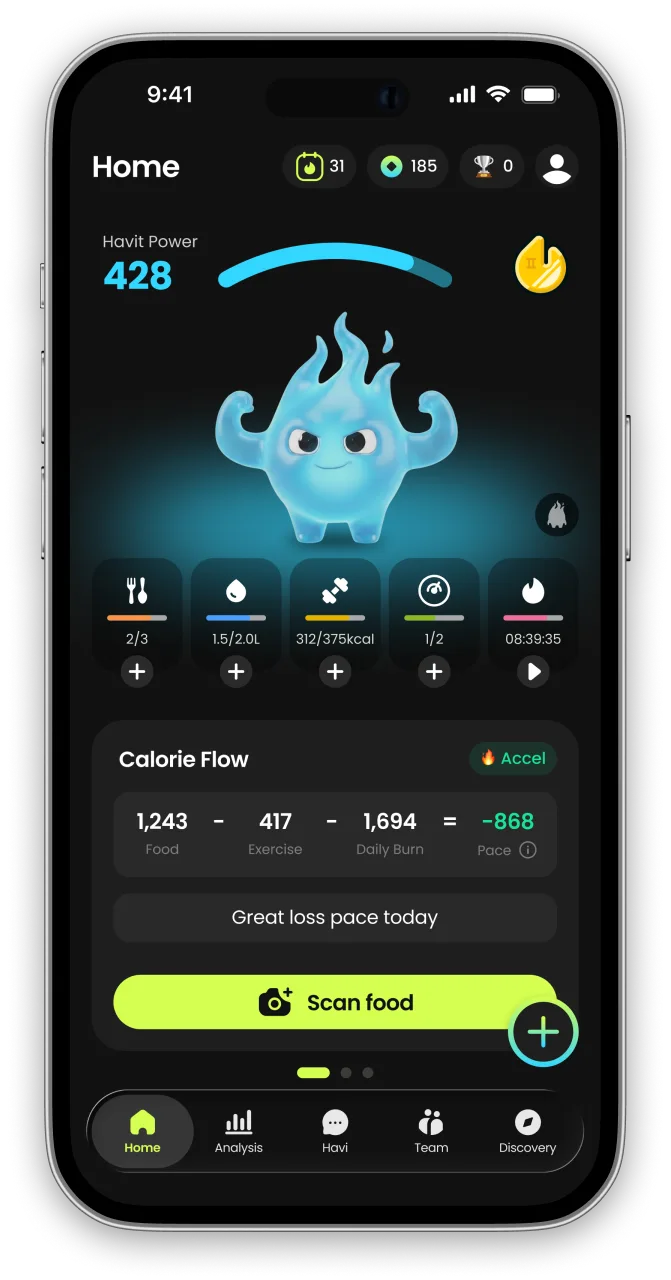
HAVIT is an AI health partner built on metabolic science — it protects your muscle, wakes up your metabolism, and helps you keep a healthy, rebound-free body for the long run.
Unlike calorie-only trackers, HAVIT connects AI body-composition estimates, nutrition, hydration, sleep, steps, cycle, mood, and GLP-1 medication in one daily routine — so progress is measured by body composition, not just the number on the scale. Daily missions turn established behavior-change techniques into small repeatable actions, drawing on expertise from professionals formerly at Juvis Diet, one of Korea’s leading metabolic clinics.
In HAVIT’s own analysis of 1,090 GLP-1 users, people who logged consistently built stronger habits than the general user base. Read the GLP-1 Habit Report
Inside the app
- AI COACHA coach that reads your day.
- NUTRITIONLog meals in seconds.
- BODY INSIGHTSSee more than weight.
- DAILY MISSIONSBuild habits you can repeat.
- DAILY CHECK-INTell HAVI how today feels.
- TRACK EVERYTHINGFrom water to GLP-1
- MIND & RECOVERYFor the days willpower runs out.


HAVIT works with or without GLP-1 medication. It is a wellness app, not a medical device; body-composition results are estimates.
Continue in the App
Personalized wellness with your own data


References
- A satiety index of common foods — European Journal of Clinical Nutrition, 1995
- Water incorporated into a food but not served with a food decreases energy intake in lean women — The American Journal of Clinical Nutrition, 1999
- Soup preloads in a variety of forms reduce meal energy intake — Appetite, 2007
- The effect of fruit in different forms on energy intake and satiety at a meal — Appetite, 2009
- Beneficial effects of a higher-protein breakfast on the appetitive, hormonal, and neural signals controlling energy intake regulation in overweight/obese, “breakfast-skipping,” late-adolescent girls — The American Journal of Clinical Nutrition, 2013
- The role of protein in weight loss and maintenance — The American Journal of Clinical Nutrition, 2015
- Protein leverage and energy intake — Obesity Reviews, 2014
- Glycaemic response to foods: Impact on satiety and long-term weight regulation — Appetite, 2007
- Improvement in chewing activity reduces energy intake in one meal and modulates plasma gut hormone concentrations in obese and lean young Chinese men — The American Journal of Clinical Nutrition, 2011
- A systematic review and meta-analysis examining the effect of eating rate on energy intake and hunger — The American Journal of Clinical Nutrition, 2014


