


Basal Metabolic Rate (BMR): What It Is and How to Calculate
Basal metabolic rate (BMR) is the energy your body burns at complete rest just to keep you alive, and it is the largest part of your daily calorie needs. Mifflin-St Jeor is one of the equations most commonly used in clinical practice. For men it is 10 × weight (kg) + 6.25 × height (cm) − 5 × age (y) + 5; for women, the same terms − 161. In a systematic review, Mifflin-St Jeor predicted resting metabolic rate within 10% of the measured value in more people than other common equations. Treat the result as an estimate, not an exact figure.
This article is for general informational purposes only and is not a substitute for professional medical advice, diagnosis, or treatment. Always consult a qualified healthcare provider with questions about a medical condition.
What basal metabolic rate actually measures
Basal metabolic rate (BMR) is the energy your body uses to stay alive when you are fully at rest. That covers breathing, pumping blood, keeping your brain and organs working and maintaining body temperature. It does not include walking, training or digesting meals.
You will also see the terms resting metabolic rate (RMR) and resting energy expenditure (REE). All three describe closely related measurements of energy use at rest, and this guide treats them together. Researchers estimate resting expenditure, like the other parts of daily energy use, with variations of a method called indirect calorimetry. The Mifflin-St Jeor equation covered below, for example, was built to predict REE.
BMR matters because it is the biggest block in your energy budget. Total daily energy expenditure is mainly made up of resting energy expenditure, physical activity energy expenditure and the thermic effect of food. Of the three, resting expenditure is the major component.
How to calculate BMR with the Mifflin-St Jeor equation
A systematic review identified Mifflin-St Jeor as one of the four prediction equations most commonly used in clinical practice. It was derived from 498 healthy adults aged 19 to 78. Of those, 264 were normal weight and 234 had obesity, and every participant had REE measured by indirect calorimetry.
The simplified versions are:
- Men: BMR = 10 × weight (kg) + 6.25 × height (cm) − 5 × age (years) + 5
- Women: BMR = 10 × weight (kg) + 6.25 × height (cm) − 5 × age (years) − 161
The result is in kcal per day. In the original data, weight, height, age and sex together explained 71% of the variation in measured REE (R² = 0.71).
Worked examples
A hypothetical woman who weighs 70 kg, is 165 cm tall and is 40 years old:
10 × 70 + 6.25 × 165 − 5 × 40 − 161 = 700 + 1,031.25 − 200 − 161 = about 1,370 kcal/day.
A hypothetical man who weighs 80 kg, is 180 cm tall and is 35 years old:
10 × 80 + 6.25 × 180 − 5 × 35 + 5 = 800 + 1,125 − 175 + 5 = 1,755 kcal/day.
The formula has two useful features. First, the gap between men and women of identical size and age is a fixed 166 kcal (5 − (−161) = 166). This matches the sex term in the full version of the equation. Second, each extra year of age subtracts 5 kcal. With weight and height unchanged, ten years lowers the estimate by 50 kcal (5 × 10).
If you know your fat-free mass
The same study also tested simpler predictors. Fat-free mass (FFM) was the best single predictor of REE (R² = 0.64). The equation was REE = 19.7 × FFM (kg) + 413. Body weight alone did less well (REE = 15.1 × weight + 371, R² = 0.56). The full equation using weight, height, age and sex was the strongest of the three.
Other BMR formulas: Harris-Benedict, WHO and Ten Haaf
Mifflin-St Jeor is not the only option. Which formula suits you best depends partly on who you are.
Harris-Benedict
The Harris-Benedict equations date from 1919. Against the measured values in the Mifflin study, they overestimated REE by 5%. A systematic review compared the four equations most used in clinical practice: Harris-Benedict, Mifflin-St Jeor, Owen and WHO/FAO/UNU. Mifflin-St Jeor was the most reliable. It predicted RMR within 10% of the measured value in more nonobese and obese individuals than any other equation, and it had the narrowest error range. The review also found that older adults and US-residing ethnic minorities were underrepresented in the studies used to build and test these equations.
Severe obesity: WHO and Harris-Benedict
The picture changes at very high body weights. A systematic review included 40 studies in adults with BMIs between 40.0 and 62.4, and pooled 20 of them in a meta-analysis. In that group, the WHO (weight) equation and Harris-Benedict were the most accurate and precise. Their average bias was −12.44 kcal/day for WHO and −18.9 kcal/day for Harris-Benedict. The other equations tested, including Mifflin, tended to underestimate BMR.
Athletes and the Ten Haaf equation
A meta-analysis pooled 29 studies with 1,430 athletes and 100 different prediction equations. The Ten-Haaf equation was the most precise. It predicted 80.2% of participants within ±10% of measured RMR, while the other equations analysed for precision ranged from 40.7% to 63.7%. Its average predictions also did not differ significantly from measured values. Four other equations, including Harris-Benedict, shared that result, but Ten-Haaf was the only one of the five with no heterogeneity between studies (I² = 0%). In the same athlete data, Mifflin-St Jeor significantly underestimated or overestimated RMR. The exact Ten Haaf coefficients are not reproduced here. The practical takeaway is that a formula built on the general population can be off for very muscular, highly trained people.
For a side-by-side look at how these methods compare, see our guide on metabolic rate calculation accuracy.
How accurate is a BMR calculator?
In the reviews above, a prediction counted as a hit if it landed within 10% of measured RMR. That sounds tight, but it is a wide band in calories. For the 1,370 kcal example above, ±10% is ±137 kcal (1,370 × 0.10). That puts the true value anywhere from about 1,233 to 1,507 kcal/day (1,370 − 137 and 1,370 + 137) and still counts as a good prediction.
Even the best equations miss some people by more than that. The systematic review that favoured Mifflin-St Jeor still described noteworthy errors when it is applied to individuals. Prediction is hard because resting metabolism varies from person to person even at the same size.
More data helps, but only up to a point. A recent study of 454 healthy adults tested machine-learning models with up to 94 predictors. The best model explained 76.8% of RMR variance. Fat-free mass, body weight and, interestingly, mean outdoor temperature were among the most useful predictors. Blood markers added a little. Gut microbiota and fecal short-chain fatty acids added nothing. Even this model left roughly 23% of the variation unexplained (100 − 76.8 = 23.2%).
Medical conditions widen the error further. In 900 patients with cirrhosis, predicted REE ranged from 501 kcal/day below to 548 kcal/day above the measured value. The authors concluded that REE should be measured directly in that group.
Similar gaps show up in other conditions, and the direction of the error is not always the same. In 34 patients with pulmonary hypertension, every estimation method tested underestimated energy needs by about 255 kcal. In 71 survivors of chronic stroke, 8 of 9 equations predicted an RMR between 9% and 18% higher than the measured value.
What is a normal BMR?
No single number counts as "normal". BMR scales with body size and composition, so a tall, muscular man and a petite woman can both be perfectly healthy with very different values. The worked examples above (about 1,370 and 1,755 kcal/day) show how wide the spread is for ordinary body sizes.
A rough sanity check is energy per kilogram. In the cirrhosis study, 282 healthy controls averaged 20.8 ± 2.6 kcal per kg of body weight per day. For a 70 kg person, that gives about 1,456 kcal/day (70 × 20.8). Treat this only as a ballpark. The ± 2.6 shows real spread between people.
If your calculated BMR seems far from expectations, check your inputs first. The equation expects weight in kilograms and height in centimetres.
From BMR to TDEE: how many calories you need per day
BMR is not your daily calorie target. Total daily energy expenditure (TDEE) adds the energy you spend moving and the energy used to digest food on top of your resting burn.
Turning a BMR into a daily figure therefore means adding an estimate of your activity, which brings its own uncertainty on top of the BMR formula. Our article on activity level tiers and nutrition scaling covers how to estimate that part realistically.
Age matters less than many people assume. A large analysis of total daily expenditure, measured by doubly labelled water in people aged 8 days to 95 years, adjusted for fat-free mass. On that basis, expenditure stayed stable in adulthood from 20 to 60 years, even during pregnancy, and declined only in older adults. A review of energy expenditure across the life course explains such changes as being at least partly due to shifts in body composition, the mass and metabolic rates of organs and tissues, and levels of physical activity.
What raises or lowers your BMR
Fat-free mass
Lean tissue is the main driver. In a study of 40 adults, fat-free mass and fat mass together explained 83% of the variability in RMR. Adding detailed organ and muscle measurements did not improve the prediction. This is why two people with the same weight but different muscle mass can have noticeably different BMRs, and why FFM-based equations work well when body composition is measured accurately.
Dieting and metabolic adaptation
Cutting calories lowers resting expenditure, partly because you lose tissue and partly through adaptation. In a controlled study, 32 nonobese men ate 50% below their energy needs for 3 weeks. They lost 6.0 kg, and their REE fell by 266 kcal/day. Adaptive thermogenesis, the drop not explained by lost fat-free mass, was 108 kcal/day. Changes in the composition of fat-free mass explained 36 kcal of that, leaving 72 kcal/day of "true" adaptation.
Environment
In the machine-learning prediction study, mean outdoor temperature was one of the key predictors of RMR. Fat-free mass and body weight were the other key predictors in the same model.
When a measured BMR is worth it
A metabolic assessment (sometimes sold as a BMR test) uses indirect calorimetry to measure your actual energy use at rest. The systematic review on prediction equations concluded that estimation errors would be eliminated by valid indirect calorimetry using an evidence-based protocol to minimise measurement error. Clinical judgement decides when an estimate is good enough.
For most healthy adults aiming for gradual weight change, a calculated BMR is a reasonable starting point. Use it to set an initial intake. Then let your weight trend over several weeks tell you whether to adjust, since the scale reflects your true energy balance better than any formula. A wearable or phone can help log weight and activity consistently.
Measurement makes more sense when estimates are known to perform poorly. That includes very high BMIs, high training loads and medical conditions that alter metabolism. It also makes sense if your intake and weight change keep failing to line up with the numbers. In those situations, the decision about clinical testing belongs with whoever is managing your care.
📊 Key Stats
Common BMR / RMR equations and what the evidence says
| Equation | Inputs | Formula or key finding | Where it performed best |
|---|---|---|---|
| Mifflin-St Jeor (men) | Weight, height, age | 10 × kg + 6.25 × cm − 5 × age + 5 | General adults: most often within 10% of measured RMR among four common equations |
| Mifflin-St Jeor (women) | Weight, height, age | 10 × kg + 6.25 × cm − 5 × age − 161 | General adults, nonobese and obese |
| Mifflin fat-free mass version | Fat-free mass | 19.7 × FFM (kg) + 413 (R² = 0.64) | When body composition is known |
| Mifflin weight-only version | Weight | 15.1 × kg + 371 (R² = 0.56) | Quick estimate; less predictive than the full equation |
| Harris-Benedict (1919) | See original publication | Overestimated measured REE by 5% in the Mifflin data | Severe obesity: bias −18.9 kcal/day |
| WHO (weight) | Weight-based; full inputs in original publication | Bias −12.44 kcal/day in severe obesity | Adults with BMI 40.0 to 62.4 |
| Ten-Haaf | See original publication | 80.2% of athletes within ±10% of measured RMR; I² = 0% | Trained athletes |
❓ Frequently Asked Questions
How do I calculate my basal metabolic rate?
What is a normal basal metabolic rate?
What is the Ten Haaf formula?
What is the difference between BMR and TDEE?
Are free online BMR calculators accurate?
Does dieting lower your BMR?
An AI weight-loss coach built by experts from Juvis Diet, one of Korea's leading weight-loss clinics
Analyze. Set targets in numbers. Coach every day.
Articles give everyone the same averages. HAVIT assesses your body first, uses the results to set daily targets in numbers, and works through them with you for 12 weeks.
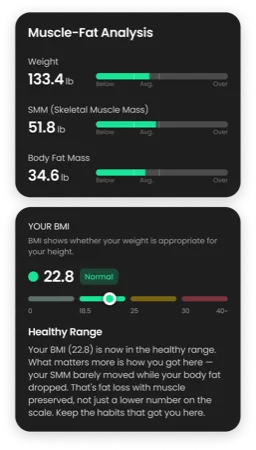
- Step 1AI body composition check, no equipment needed
Just your height, weight, age, and a few lifestyle questions are enough to estimate your body composition. In our own study (70 people), estimates were 92.9% accurate compared with InBody measurements.
- HAVIT Score and basal metabolic rate
- Muscle-fat analysis and body composition type
- Obesity level, abdominal fat ratio, and visceral fat
- Body blueprint: healthy goal weight, waist-to-height ratio, and safe rate of weight loss
- 6-stage habit analysis
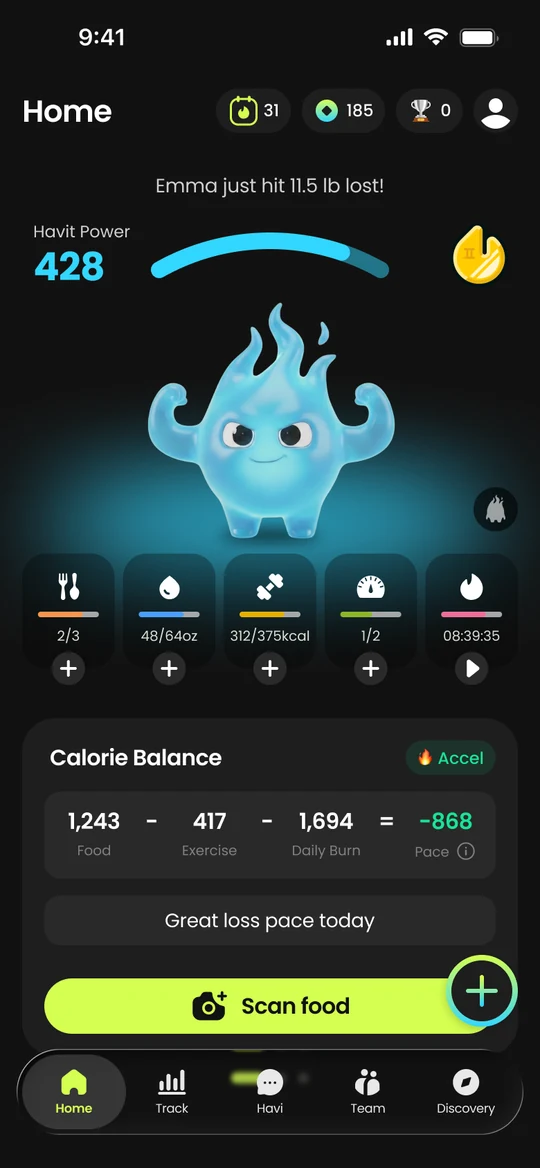
- Step 211 daily targets, set in numbers
Your results set exact numbers for what to hit each day. Targets are readjusted every week based on how your weight changes.
- Calorie intake, protein, carbs, fat, and fiber
- Calories burned and steps
- Sleep and water
- Weigh-in frequency and target BMI
- Step 3Daily action and AI coaching
A plan only works if you follow it. We make logging easy and your next step clear.
- Log meals with a single photo
- AI coach HAVI reads your logs and suggests one thing to do today
- Personalized plans across 126+ categories based on your results
- CBT-based coaching for your mindset, not just your diet


- All-in-oneEverything in one app
No more switching between apps. When everything about your body lives in one place, your AI coach can see the full picture.
- Meals, water, workouts, and steps
- Sleep, weight, and body composition trends
- Menstrual cycle, mood, and daily check-ins
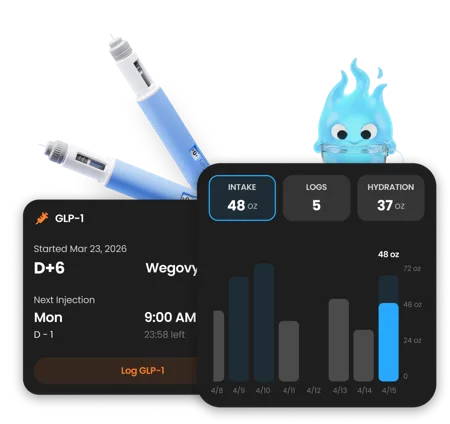
- GLP-1 medication logs and reminders
- Guided meditation, workout videos, and running coach
- Challenges and avatars that make it feel like a game



Analysis of 78 people (41 HAVIT, 37 control) with InBody results at week 1 and week 12, June–August 2026. Non-blinded study.
HAVIT is a wellness app, not a medical device. Body composition results are estimates.
A new quiz and health tip every day
Follow HAVIT on Instagram and Threads. @havit_app.en
References
- A new predictive equation for resting energy expenditure in healthy individuals. — The American journal of clinical nutrition, 1990
- Comparison of predictive equations for resting metabolic rate in healthy nonobese and obese adults: a systematic review. — Journal of the American Dietetic Association, 2005
- Accuracy of Resting Metabolic Rate Prediction Equations in Athletes: A Systematic Review with Meta-analysis. — Sports medicine (Auckland, N.Z.), 2023
- Adequacy of basal metabolic rate prediction equations in individuals with severe obesity: A systematic review and meta-analysis. — Obesity reviews : an official journal of the International Association for the Study of Obesity, 2024
- Predicting resting metabolic rate in healthy adults: a comparative analysis using the enable cohort. — American journal of physiology. Endocrinology and metabolism, 2026
- Predicted estimates of resting energy expenditure have limited clinical utility in patients with cirrhosis. — Journal of hepatology, 2022
- Estimating Resting Energy Expenditure by Different Methods as Compared With Indirect Calorimetry for Patients With Pulmonary Hypertension. — Nutrition in clinical practice : official publication of the American Society for Parenteral and Enteral Nutrition, 2018
- Predictive Equations Overestimate Resting Metabolic Rate in Survivors of Chronic Stroke. — Archives of physical medicine and rehabilitation, 2022
- Relationship between resting metabolic rate and the composition of the fat-free mass. — Metabolism: clinical and experimental, 1997
- Metabolic adaptation to caloric restriction and subsequent refeeding: the Minnesota Starvation Experiment revisited. — The American journal of clinical nutrition, 2015
- Daily energy expenditure through the human life course. — Science (New York, N.Y.), 2021
- Energy Expenditure in Humans: Principles, Methods, and Changes Throughout the Life Course. — Annual review of nutrition, 2024