

Oura Ring 4 Skin Temperature vs BBT Charting: Which Actually Catches Ovulation?
In an Oura-run validation study, the ring's temperature-based algorithm detected 96.4% of LH-test-confirmed ovulations (average error about 1.3 days). Classic BBT misses a clear shift in roughly 1 in 5 ovulatory cycles and depends on daily morning readings. Both confirm ovulation after the fact, and large head-to-head comparisons are lacking.
This article is for general informational purposes only and is not a substitute for professional medical advice, diagnosis, or treatment. Always consult a qualified healthcare provider with questions about a medical condition.
The 3 AM Problem With Temperature Tracking
Picture setting an alarm for 5:47 AM every single day for months. Same time. Same thermometer. Same routine of lying completely still, reaching for the device before even opening your eyes fully. That's what traditional basal body temperature charting asks of you. It works—until a trip to a different time zone throws everything off, and you spend two weeks wondering if your chart is showing anything real.
This is the fundamental tension in temperature-based fertility awareness. The method works. Decades of research confirm that body temperature shifts around ovulation. But the traditional approach demands a level of consistency that clashes with how most people actually live.
Oura Ring 4 promises something different: continuous temperature monitoring while you sleep, no alarms required. But does measuring skin temperature from your finger actually compare to the oral readings that fertility awareness methods were built on?
What Your Temperature Actually Does During a Cycle
Here's the biology in plain terms. Before ovulation, your body runs cooler. After the egg releases, progesterone floods your system and acts like turning up your internal thermostat. This shift is small—we're talking about 0.2 to 0.5 degrees Celsius—but it's consistent enough that tracking it reveals where you are in your cycle.
Traditional BBT charting catches this by having you measure your core temperature first thing in the morning, before any activity that might affect the reading. The catch? "First thing" means before getting up to use the bathroom. Before checking your phone. Before that stretch you do without thinking. Any movement generates heat and muddles the data.
Skin temperature works on the same principle but measures something slightly different. Your finger temperature reflects your core temperature, but it's also influenced by blood flow to your extremities. During the luteal phase (post-ovulation), peripheral blood flow patterns change alongside that core temperature rise.
How closely do the two track each other? In a 2019 pilot study published in BMC Women's Health, 22 women wore an Oura ring while also taking oral temperatures after waking. Nightly finger skin temperature rose by about 0.30°C in the luteal phase, versus 0.23°C for oral temperature, and the two measurements were moderately correlated (r = 0.56). Similar pattern, different signal.
How Oura Ring 4's Temperature Sensing Actually Works
The Ring 4 uses negative temperature coefficient sensors that take readings throughout the night. Not once. Not twice. Continuously. The device samples your skin temperature and reports it as a deviation from your personal baseline rather than an absolute number.
This deviation approach matters. Your normal body temperature might run warmer or cooler than someone else's. What the algorithm cares about is the pattern: are you trending higher or lower than your own average?
The ring establishes your baseline over the first two weeks of use, then shows daily deviations in the app. A sustained upward shift of 0.2°C or more, lasting several days, typically indicates the post-ovulatory phase has begun.
One practical advantage: because the ring collects readings across the whole night, it captures temperature during deep sleep—exactly the hours when a traditional thermometer would require you to wake up.
The Accuracy Question: What the Studies Show
Let's get specific about numbers, because vague claims help no one.
The largest validation so far comes from Oura's own researchers. In a 2025 analysis in the Journal of Medical Internet Research covering 1,155 ovulatory cycles from 964 users, with home ovulation (LH) tests as the benchmark, the ring's temperature-based algorithm detected 96.4% of ovulations, with an average error of 1.26 days—compared with 3.44 days for the calendar method. Keep in mind that the authors work for Oura and the data came from the company's user database.
Traditional BBT has its own blind spots. In a classic 1976 study in Fertility and Sterility that checked BBT charts against hormone tests, roughly 20% of cycles that were ovulatory by hormone levels showed no clear temperature shift. And BBT only works if you measure every morning—missed or disturbed readings leave gaps that make a chart hard to interpret.
No large study has compared Oura and a carefully kept BBT chart head-to-head in the same people, so any single accuracy score pitting one against the other would be a guess. What the evidence does suggest is that passive overnight measurement removes BBT's biggest practical weakness: inconsistent daily readings.
Consistency beats theoretical precision when you're trying to understand your own body.
Where BBT Still Has Advantages
I don't want to dismiss traditional charting entirely. It has genuine strengths that a ring on your finger can't replicate.
BBT gives you an absolute temperature reading. If your temperature spikes to 37.8°C, you know something's happening—maybe illness, maybe ovulation, maybe both. Oura's deviation model can flag the change but won't tell you the actual number without additional context.
Traditional charting also integrates with other fertility awareness markers more naturally. The sympto-thermal method combines temperature with cervical mucus observations and sometimes cervical position checks. In a long-term German cohort of 900 women (17,638 cycles), this method had a pregnancy rate of 0.6 per 100 women over 13 cycles when couples avoided unprotected intercourse during the fertile window—provided its rules were followed consistently.
Oura Ring 4 focuses primarily on temperature, though it does incorporate heart rate variability data that can provide supporting information about cycle phase.
And there's cost. A quality BBT thermometer runs $15-30 and lasts for years. Oura Ring 4 costs $349 plus a $6 monthly subscription after the first month. For someone just wanting to understand their cycle basics, that's a significant difference.
The Sleep Quality Variable Nobody Talks About
Here's something that doesn't get enough attention in these comparisons: both methods are affected by sleep quality, but in different ways.
Poor sleep throws off BBT readings because fragmented rest means your body never reaches that stable baseline temperature. The standard guidance says you need at least three consecutive hours of sleep before taking a BBT measurement. For new parents, shift workers, or anyone with insomnia, this requirement can make charting nearly impossible.
Oura's continuous monitoring handles disrupted sleep differently. The algorithm can identify the most stable temperature readings from whatever sleep you did get. It's not perfect—very short or heavily broken nights still produce noisier readings—but it's more forgiving than the all-or-nothing nature of a single morning measurement.
For new parents, shift workers, and anyone who rarely sleeps three hours straight, that flexibility can be the difference between having some usable data and having none.
Practical Patterns: What Real Users Experience
Beyond the studies, a few practical differences stand out.
The learning curve differs substantially. BBT charting requires understanding what you're looking at—the coverline concept, how to identify a sustained shift, when to discard an outlier reading. Most people need two to three cycles before they feel confident interpreting their own charts.
Oura's app does interpretation for you, which is both a strength and a limitation. You see "temperature trending up" without necessarily understanding why. Some users find this empowering; others feel disconnected from their own data.
Travel affects each method differently. Crossing time zones disrupts BBT charting significantly—your body's temperature rhythm takes days to adjust. Oura handles travel better because it's tracking your actual sleep, whenever that happens to occur. The deviation from baseline remains meaningful even if your schedule shifts.
Alcohol consumption raises skin temperature noticeably. It helps to mentally flag nights when you've had drinks, knowing those readings may run artificially high. Traditional BBT is affected too, but the single morning reading might miss the peak effect if you've metabolized most of the alcohol by wake time.
Combining Approaches: The Hybrid Method
Some cycle trackers use both methods—not as redundancy, but as complementary data streams.
The approach looks like this: Oura provides continuous baseline data with minimal effort. On days when the app shows temperature trending upward, they take a traditional BBT reading for confirmation. This catches the benefits of wearable consistency while maintaining the absolute temperature reference that BBT provides.
In practice, that might mean checking the ring's trend each morning, skipping the thermometer while readings sit in your normal range, and taking oral readings for a few days when the app flags a shift. That avoids daily early alarms while still giving you an absolute reference.
This hybrid approach won't work for everyone—it requires owning both devices and being willing to occasionally take manual measurements. But for those finding pure BBT too demanding and pure wearable data too abstract, it's worth considering.
What the Data Can and Cannot Tell You
Temperature tracking, regardless of method, confirms ovulation retrospectively. The shift happens after the egg releases. By the time you see it in your data, your fertile window has likely closed.
This matters depending on your goals. For pregnancy avoidance, retrospective confirmation is valuable—it tells you when you've entered the infertile luteal phase. For conception attempts, it's less immediately useful, though tracking patterns over multiple cycles helps predict future timing.
Neither Oura nor BBT charting will tell you exactly when ovulation will occur in advance. They show you patterns that, combined with cycle history, allow educated predictions. But bodies aren't perfectly predictable. Stress, illness, travel, and countless other factors can shift ovulation timing.
Temperature data are far better at confirming ovulation after the fact than at forecasting it. Predictions for upcoming cycles lean on your cycle history and become less reliable when cycles are irregular. Temperature tracking excels at pattern recognition over multiple cycles rather than precise prediction in any single cycle.
Making the Choice That Fits Your Life
The right method depends on factors that have nothing to do with accuracy percentages.
If you sleep consistently, don't mind morning routines, and want detailed understanding of your cycle mechanics, traditional BBT charting teaches you more about your body. The learning process itself has value.
If your sleep is irregular, you travel frequently, or you simply won't maintain a daily charting habit, Oura Ring 4's passive collection produces more usable data over time. Imperfect data you actually have beats perfect data you don't.
If you're using temperature tracking for pregnancy avoidance as a primary method, consider whether either approach alone provides sufficient confidence for your risk tolerance. Many fertility awareness educators recommend combining temperature with other signs rather than relying on any single indicator.
The technology has genuinely improved. Continuous wearable monitoring solves real problems that made traditional charting impractical for many people. But it hasn't made understanding your cycle effortless—it's just shifted where the effort goes, from consistent morning measurements to learning what the data actually means for your body.
📊 Key Stats
Oura Ring 4 vs Traditional BBT Charting for Ovulation Detection
| Factor | Oura Ring 4 | Traditional BBT |
|---|---|---|
| Validation evidence | Detected 96.4% of LH-confirmed ovulations (company-run study) | No clear shift in ~20% of ovulatory cycles (small hormone study) |
| Daily effort | Wear the ring to bed | Measure every morning before getting up |
| Measurement timing | Continuous overnight | Single morning reading |
| Sleep requirement | Tolerates broken sleep (noisier on short nights) | 3+ consecutive hours required |
| Travel impact | Minimal | Significant disruption |
| Initial cost | $349 + subscription | $15-30 one-time |
| Learning curve | App interprets data | 2-3 cycles to understand patterns |
| Data type | Deviation from baseline | Absolute temperature |
Based on published studies (Thigpen 2025, Maijala 2019, Moghissi 1976); no large head-to-head trial exists, and individual results vary
❓ Frequently Asked Questions
Can Oura Ring 4 predict ovulation before it happens?
How long does Oura Ring 4 take to establish a temperature baseline?
Does alcohol affect Oura temperature readings?
Is skin temperature from a finger as accurate as oral BBT?
Can I use Oura Ring 4 for pregnancy avoidance?
How does poor sleep affect each method?
Why doesn't Oura show my actual temperature number?
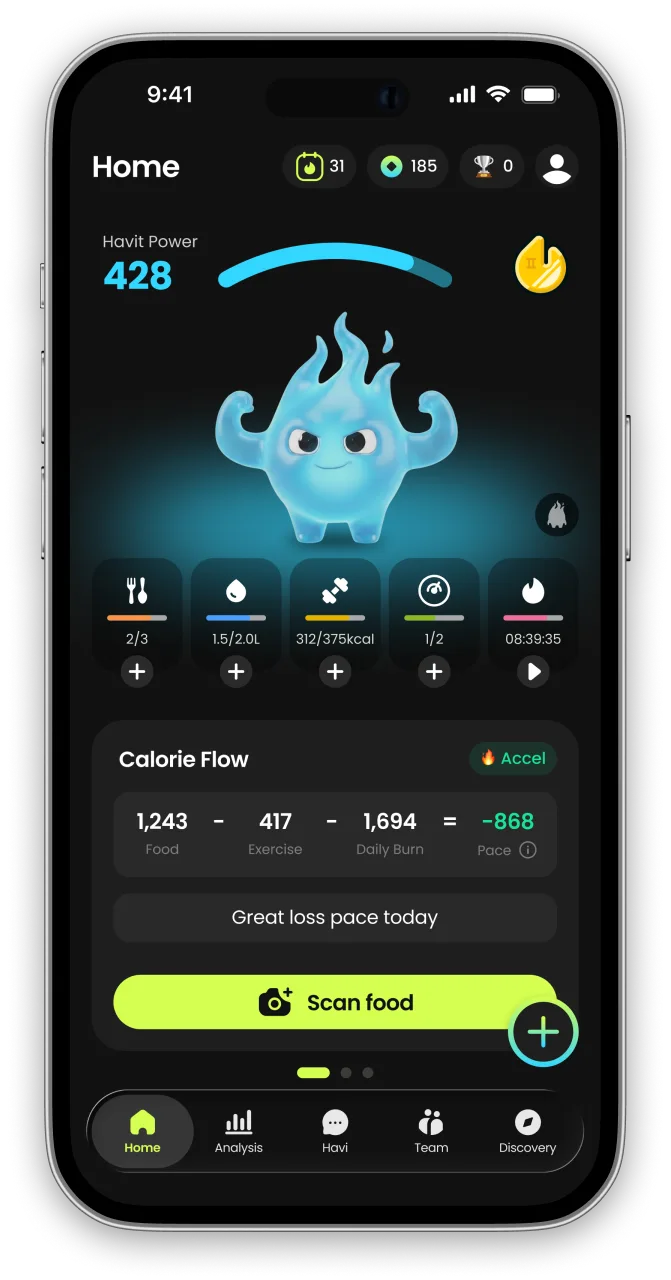
What is HAVIT?
HAVIT is an AI health partner built on metabolic science — it protects your muscle, wakes up your metabolism, and helps you keep a healthy, rebound-free body for the long run.
Unlike calorie-only trackers, HAVIT connects AI body-composition estimates, nutrition, hydration, sleep, steps, cycle, mood, and GLP-1 medication in one daily routine — so progress is measured by body composition, not just the number on the scale. Daily missions turn established behavior-change techniques into small repeatable actions, drawing on expertise from professionals formerly at Juvis Diet, one of Korea’s leading metabolic clinics.
In HAVIT’s own analysis of 1,090 GLP-1 users, people who logged consistently built stronger habits than the general user base. Read the GLP-1 Habit Report
Inside the app
- AI COACHA coach that reads your day.
- NUTRITIONLog meals in seconds.
- BODY INSIGHTSSee more than weight.
- DAILY MISSIONSBuild habits you can repeat.
- DAILY CHECK-INTell HAVI how today feels.
- TRACK EVERYTHINGFrom water to GLP-1
- MIND & RECOVERYFor the days willpower runs out.


HAVIT works with or without GLP-1 medication. It is a wellness app, not a medical device; body-composition results are estimates.

Continue in the App
Personalized wellness with your own data


References
- Oura Ring as a Tool for Ovulation Detection: Validation Analysis — Journal of Medical Internet Research, 2025
- Nocturnal finger skin temperature in menstrual cycle tracking: ambulatory pilot study using a wearable Oura ring — BMC Women's Health, 2019
- Accuracy of Basal Body Temperature for Ovulation Detection — Fertility and Sterility, 1976
- Innovative Approaches to Menstruation and Fertility Tracking Using Wearable Reproductive Health Technology: Systematic Review — Journal of Medical Internet Research, 2024
- The effectiveness of a fertility awareness based method to avoid pregnancy in relation to a couple's sexual behaviour during the fertile time: a prospective longitudinal study — Human Reproduction, 2007


